


In [Schwartz et al. 1988], the firing rate of each tuned cell  is
approximated by a linear combination of
the normalized Cartesian coordinates of the target toward which the monkey is
reaching. These coordinates are relative to the initial hand position
is
approximated by a linear combination of
the normalized Cartesian coordinates of the target toward which the monkey is
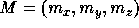
reaching. These coordinates are relative to the initial hand position  and are given by a unit vector in the direction of motion
 .
The linear approximation is
.
The linear approximation is
and an F test showed that the variance of 83.6% of all cells was at least
partly accounted for by this linear regression.
The preferred direction vector  is calculated from


and we can now write
which is equivalent to equation 1. Note that
cells with  are not sensitive to the direction of movement and
were not analyzed further, so
are not sensitive to the direction of movement and
were not analyzed further, so  .
.
To understand results R1 and R2, I perform a
simplified analysis of movement in 2 dimensions (the extension to 3
dimensions is straightforward but complicates the notation significantly).
For a fixed initial hand
position and with all other variables held constant, consider any arbitrary
firing rate function
 which depends on the direction of hand movement
  .
.
 is a periodic variable, so the output of
  will
be periodic, and if 8 uniformly spaced
directions are tested then the complete behavior can
be described by a discrete Fourier series with periods up to
will
be periodic, and if 8 uniformly spaced
directions are tested then the complete behavior can
be described by a discrete Fourier series with periods up to 
where  is the phase for each angular
frequency component k.
Note that for k>1 the terms have no directional component, since they
consist of either 2, 3, or 4 ``lobes'' symmetrically placed around the
circle. Thus a linear regression on the Cartesian coordinates
is the phase for each angular
frequency component k.
Note that for k>1 the terms have no directional component, since they
consist of either 2, 3, or 4 ``lobes'' symmetrically placed around the
circle. Thus a linear regression on the Cartesian coordinates
 will be unaffected by the values of
 , and
, and  and will depend only on
  and
and
 . To see this, note that linear regression computes the
three expected values:
. To see this, note that linear regression computes the
three expected values:
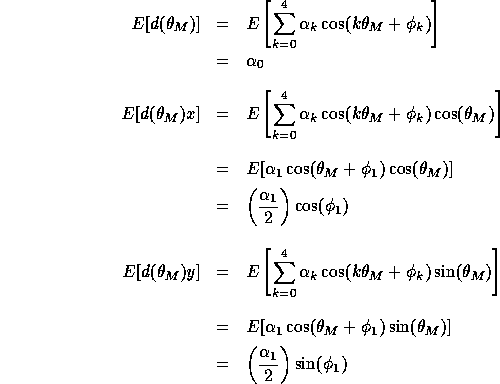
where the expectation operator  is taken over all tested directions
 . The preferred direction is therefore equal to
 and is independent of
  , or
, or  . Even if more
than 8 directions are tested, the linear regression will respond only to
the
. Even if more
than 8 directions are tested, the linear regression will respond only to
the  component.
The ``goodness
of fit'' to the linear regression is the extent to which the k=0 and
k=1 terms capture the behavior of  .
However, it is important to realize that a statistically significant F
test does not indicate a good fit to a linear model in the sense of
having small prediction error variance. Fit is determined by mean squared
error which distributes according to a
.
However, it is important to realize that a statistically significant F
test does not indicate a good fit to a linear model in the sense of
having small prediction error variance. Fit is determined by mean squared
error which distributes according to a  statistic.
The F test only estimates the probability that the linear model accounts
for some portion of the total variance. This is equivalent to testing if
statistic.
The F test only estimates the probability that the linear model accounts
for some portion of the total variance. This is equivalent to testing if
 is significantly different from 0. A significant F test does not
imply that
is significantly different from 0. A significant F test does not
imply that  describes the dominant response behavior, and
 ,
,  , or
, or  might well be larger.
If a set of tuning curves were generated randomly by selecting the coefficients
might well be larger.
If a set of tuning curves were generated randomly by selecting the coefficients
 independently from a normal distribution, then one would expect
95% of the tuning
curves to have statistically significant values of
independently from a normal distribution, then one would expect
95% of the tuning
curves to have statistically significant values of  . Thus the
observed value of 83.6% (93% in [Caminiti et al. 1990]) does not support
statistical arguments that the population has been ``engineered'' to have
directional tuning.
. Thus the
observed value of 83.6% (93% in [Caminiti et al. 1990]) does not support
statistical arguments that the population has been ``engineered'' to have
directional tuning.
Since this method of analysis ignores terms for k>1, it in effect low-pass filters the tuning curves. So the cosine tuning results from the method of analysis and may not be justified by the original data. These considerations show that result R2 does not provide any information beyond result R1, since R2 would be true for a randomly chosen set of tuning curves satisfying R1 which were analyzed in this way.
True cosine tuning could be verified by fitting equation 1 to
data samples from many different directions and measuring the average
mean-squared approximation error over the population using a  statistic. A similar test was done in the
2-dimensional case, where it was found that 75% of 241
cells had a normalized mean-squared approximation
error less than 30% of the total variance[Georgopoulos et al. 1982]. Although this is
not a statistically good fit to the population, there may have been
individual cells whose response was well predicted by cosine tuning.
statistic. A similar test was done in the
2-dimensional case, where it was found that 75% of 241
cells had a normalized mean-squared approximation
error less than 30% of the total variance[Georgopoulos et al. 1982]. Although this is
not a statistically good fit to the population, there may have been
individual cells whose response was well predicted by cosine tuning.
What is the significance of the cells which were well fit by a cosine
tuning curve? As shown in equation 6, these cells have a
response d which is approximately linearly related to the hand movement
vector M. We can thus claim either that these cells are in fact linear
in the movement direction, or else that they are linear in the testing region
but may be nonlinear if tested in other regions of space. So
if we write the response as  where
where  is the initial hand
position and X is the target, then we know that
is the initial hand
position and X is the target, then we know that
 must be sufficiently smooth that it appears locally linear for
the positions X which were tested.
must be sufficiently smooth that it appears locally linear for
the positions X which were tested.
Over larger distances, d may not be well approximated linearly, but it can still be written as
where  emphasizes that the preferred direction may become dependent
on the initial position, as was indeed found in [Caminiti et al. 1990].
But equation 8 is a general
representation for arbitrary smooth functions, so even an accurate
fit to a locally linear function does not allow one to claim much beyond
the fact that the preferred direction remains approximately constant over
the tested region.
emphasizes that the preferred direction may become dependent
on the initial position, as was indeed found in [Caminiti et al. 1990].
But equation 8 is a general
representation for arbitrary smooth functions, so even an accurate
fit to a locally linear function does not allow one to claim much beyond
the fact that the preferred direction remains approximately constant over
the tested region.



